Tech Blog Tableau
Tableau
Hello everyone! Today I am here to talk about a fascinating app I recently came across when scrolling through my phone. The app is called Tableau. Tableau is an app you can download to either your laptop or the mobile app on your phone. It is an app that can be useful to aspiring sports journalists like me. Tableau has powerful data visualization tools that can offer immense value to sports journalists, with all the statistics we find ourselves going through on a day-to-day basis. Let's delve into how the app can enhance the reporting and storytelling skills of journalists.
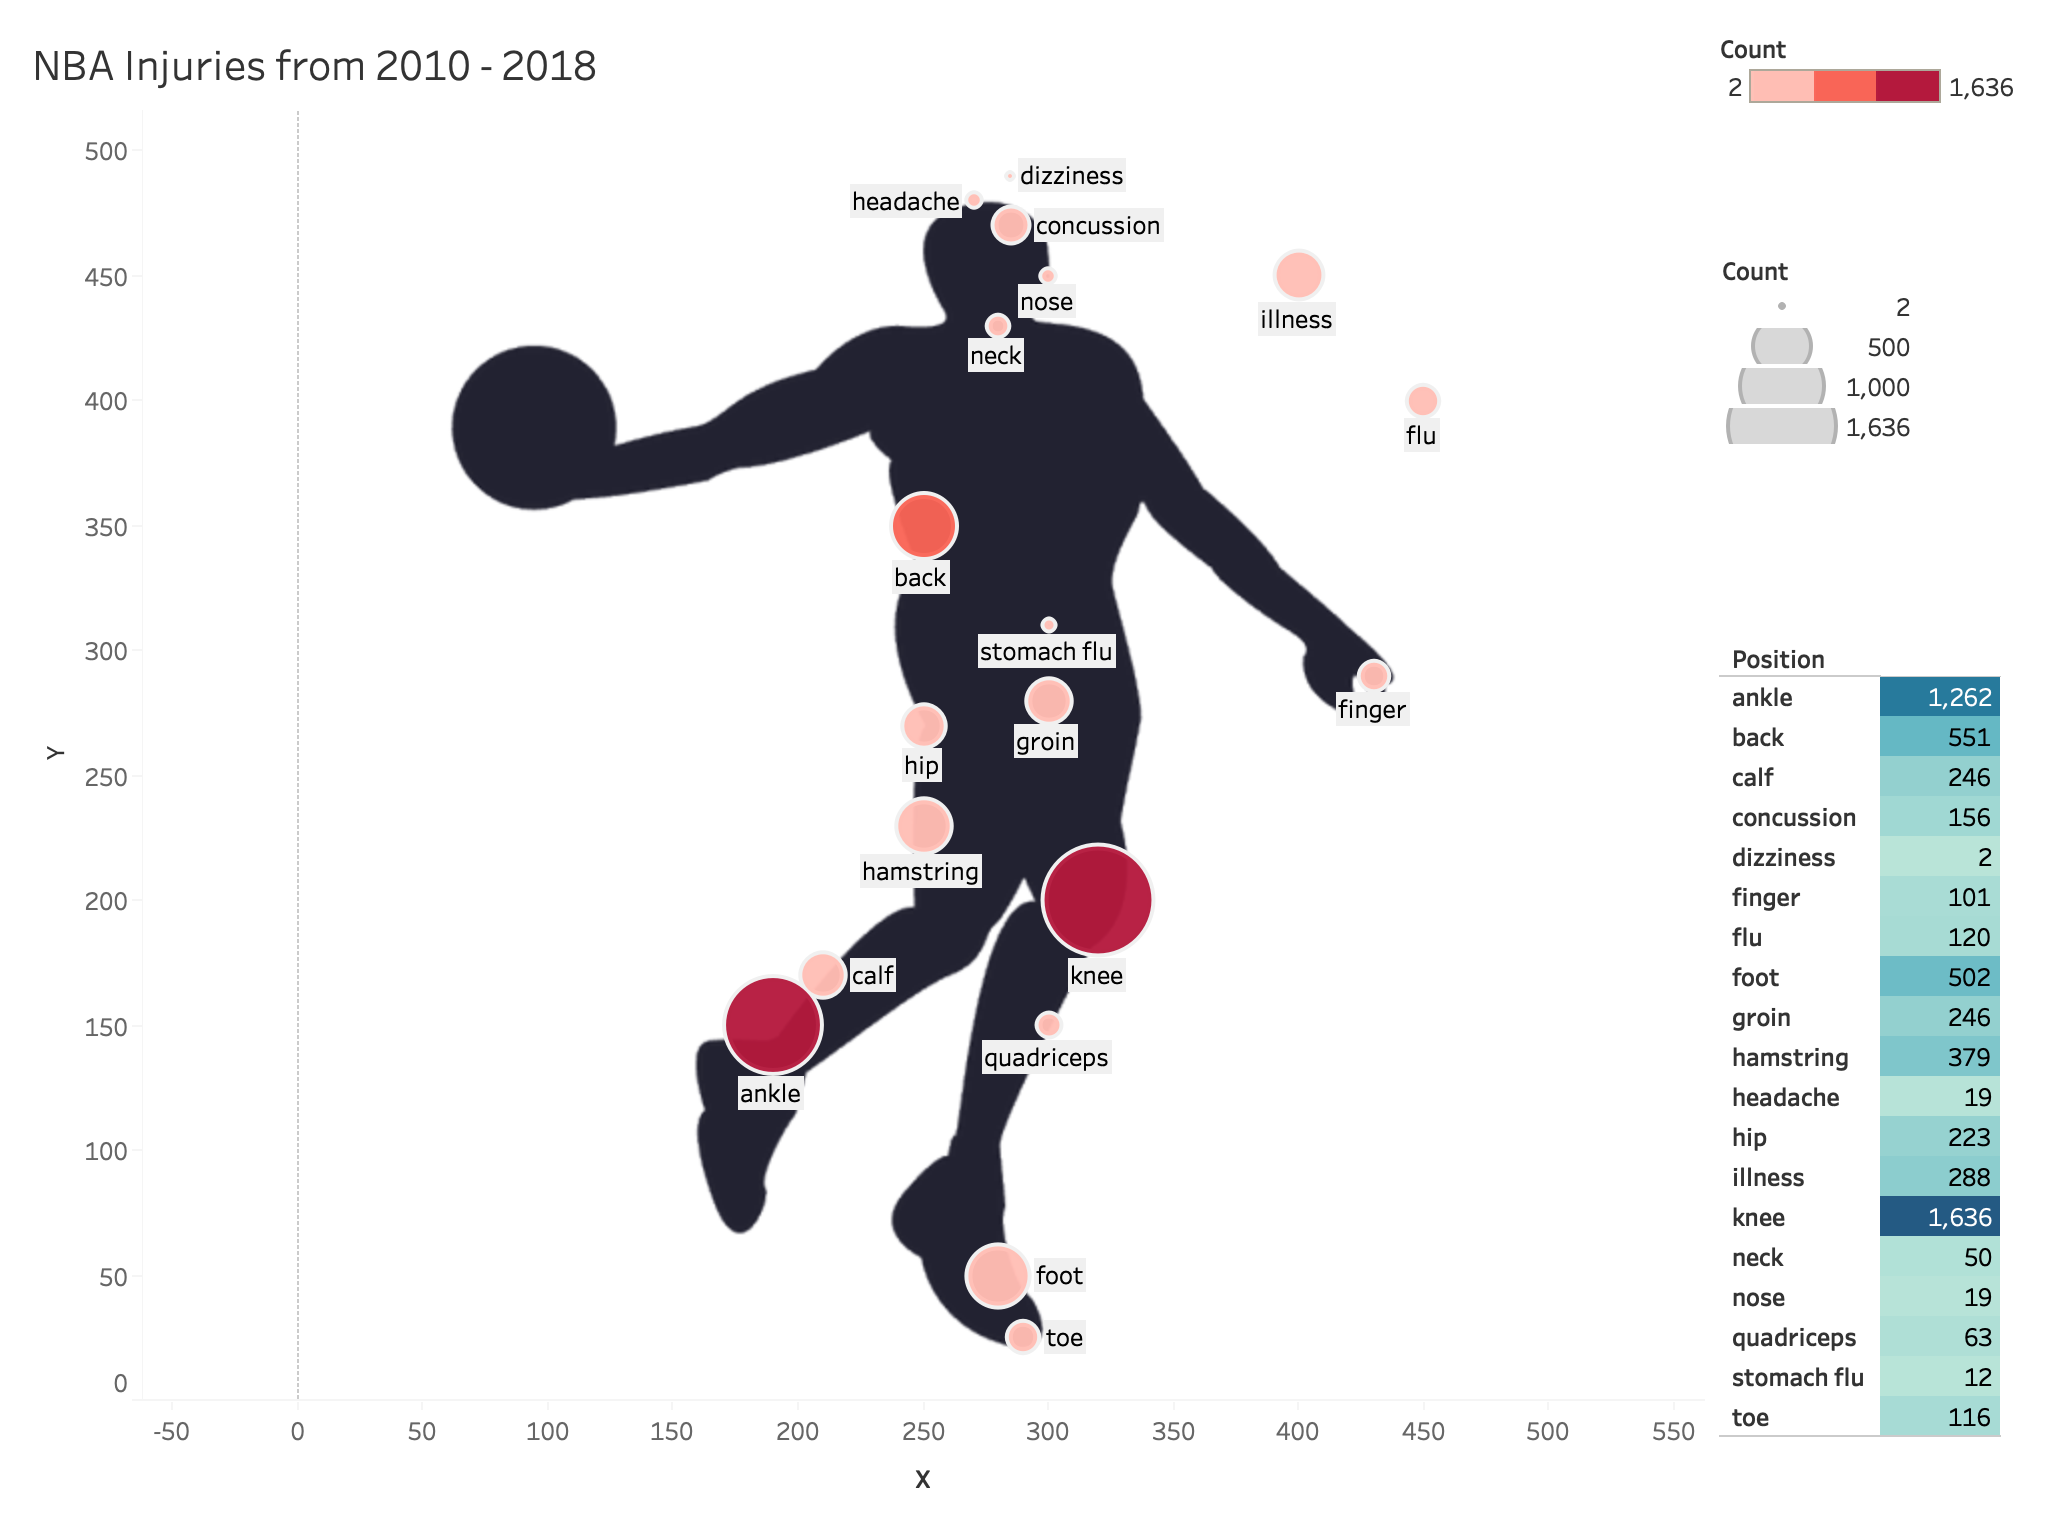
The first point I want to bring up about Tableau is how you can use it to visualize complex data. Sports journalism often involves analyzing intricate statistics, player performance, and game outcomes. Tableau allows journalists to take this raw data and transform it into compelling visualizations. Whether it's presenting shooting averages from a basketball player, player heat maps in soccer, or team power rankings from baseball, Tableau's interactive charts, graphs, and dashboards make some complex information more accessible to readers.
The next aspect of Tableau I'd like to talk about is how you can customize your storytelling on the app. Every sports story has unique angles and dimensions. With Tableau, journalists can customize their narratives. Whether it's analyzing a team's winning streak, a player who is on a hot streak, or the impact of injuries on a team, Tableau's visualizations allow for tailored storytelling.
Sports fans crave engagement in the media beyond just reading the traditional article about a topic. Tableau enables journalists within their dashboards to create interactive content for their readers. These dashboards can either be embedded in the articles themselves or posted on social media elsewhere to get more interactions.
Comments
Post a Comment